세계 100위 브랜드 2018~2021
2022. 10. 2. 17:39ㆍ경제
728x90
반응형
2022년 1/4분기에 조사했던 세계 100위 브랜드 순위입니다.
이당시에는 2022년의 브랜드 순위가 집계가 되지 않아서 2021년의 브랜드 순위가 최신이었네요.
하는 김에 2018~2021의 순위변화도 같이 조사해봤습니다.
좀더 보기 쉽게 도표도 같이 만들었는데 20위 단위로 끊었더니 너무 복잡해져서 보기 힘드네요
코로나와 금리 인상기를 맞아서 순위 많은 변동이 있을것 같은데 2022년의 데이터는 2023년 1분기는 되야 조사가 가능할지도....
| Brand | 2018년 | 2019년 | 2020년 | 2021년 | Brand Value |
Cartegory | Brand Value %Change 2021 VS. 2020 |
| Amazon | 3 | 1 | 1 | 1 | $683.85 | Consumer Goods & Retail | 64% |
| Apple | 2 | 2 | 2 | 2 | $612.00 | Technology | 74% |
| 1 | 3 | 4 | 3 | $458.00 | Media & Entertainment | 42% | |
| Microsoft | 4 | 4 | 3 | 4 | $410.27 | Business Solutions & Tech Providers | 26% |
| Tencent | 5 | 8 | 7 | 5 | $240.93 | Media & Entertainment | 60% |
| 6 | 6 | 8 | 6 | $226.74 | Media & Entertainment | 54% | |
| Alibaba | 9 | 7 | 6 | 7 | $196.91 | Consumer Goods & Retail | 29% |
| Visa | 7 | 5 | 5 | 8 | $191.29 | Financial Services | 2% |
| McDonald's | 8 | 9 | 9 | 9 | $154.92 | Food & Beverages | 20% |
| Mastercard | 15 | 12 | 10 | 10 | $112.88 | Financial Services | 4% |
| Moutai | 34 | 35 | 18 | 11 | $109.33 | Food & Beverages | 103% |
| Nvidia | 12 | $104.76 | Business Solutions & Tech Providers | ||||
| Verizon | 12 | 11 | 12 | 13 | $101.94 | Telecom Providers | 8% |
| AT&T | 10 | 10 | 11 | 14 | $100.65 | Telecom Providers | -5% |
| IBM | 11 | 13 | 14 | 15 | $91.34 | Business Solutions & Tech Providers | 9% |
| Coca-Cola | 14 | 14 | 13 | 16 | $87.60 | Food & Beverages | 4% |
| Nike | 29 | 21 | 21 | 17 | $83.71 | Consumer Goods & Retail | 68% |
| 91 | 44 | 29 | 18 | $82.90 | Media & Entertainment | 100% | |
| PayPal | 30 | 26 | 23 | 19 | $80.62 | Payments | 66% |
| Adobe | 75 | 45 | 35 | 20 | $78.52 | Business Solutions & Tech Providers | |
| Louis Vuitton | 26 | 22 | 21 | $75.73 | Consumer Goods & Retail | 46% | |
| UPS | 16 | 18 | 20 | 22 | $73.02 | Logistics | 44% |
| Intel | 38 | 36 | 33 | 23 | $71.94 | Business Solutions & Tech Providers |

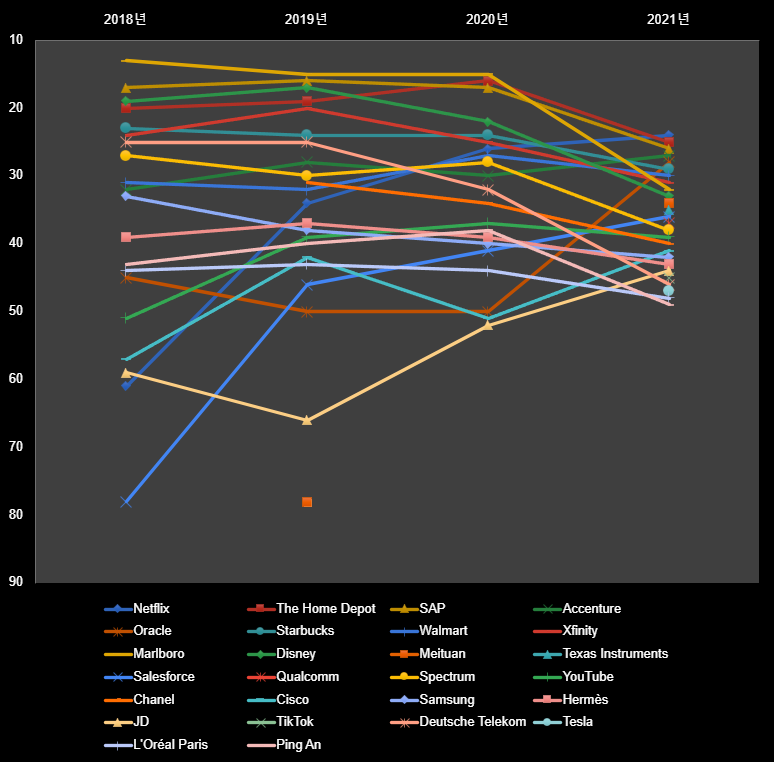
| Brand | 2018년 | 2019년 | 2020년 | 2021년 | Brand Value |
Cartegory | Brand Value %Change 2021 VS. 2020 |
| Netflix | 61 | 34 | 26 | 24 | $71.13 | Media & Entertainment | 55% |
| The Home Depot | 20 | 19 | 16 | 25 | $70.52 | Consumer Goods & Retail | 22% |
| SAP | 17 | 16 | 17 | 26 | $69.24 | Business Solutions & Tech Providers | 20% |
| Accenture | 32 | 28 | 30 | 27 | $64.73 | Business Solutions & Tech Providers | |
| Oracle | 45 | 50 | 50 | 28 | $60.84 | Business Solutions & Tech Providers | |
| Starbucks | 23 | 24 | 24 | 29 | $60.27 | Food & Beverages | 26% |
| Walmart | 31 | 32 | 27 | 30 | $59.52 | Consumer Goods & Retail | 30% |
| Xfinity | 24 | 20 | 25 | 31 | $59.00 | Telecom Providers | 26% |
| Marlboro | 13 | 15 | 15 | 32 | $57.01 | Consumer Goods & Retail | -2% |
| Disney | 19 | 17 | 22 | 33 | $55.22 | Media & Entertainment | 13% |
| Meituan | 78 | 34 | $52.40 | Technology | 119% | ||
| Texas Instruments | 35 | $49.24 | Business Solutions & Tech Providers | ||||
| Salesforce | 78 | 46 | 41 | 36 | $48.98 | Business Solutions & Tech Providers | 61% |
| Qualcomm | 37 | $48.36 | Business Solutions & Tech Providers | ||||
| Spectrum | 27 | 30 | 28 | 38 | $47.28 | Telecom Providers | 10% |
| YouTube | 51 | 39 | 37 | 39 | $47.10 | Media & Entertainment | 39% |
| Chanel | 31 | 34 | 40 | $47.05 | Consumer Goods & Retail | 30% | |
| Cisco | 57 | 42 | 51 | 41 | $46.82 | Business Solutions & Tech Providers | |
| Samsung | 33 | 38 | 40 | 42 | $46.77 | Technology | 44% |
| Hermès | 39 | 37 | 39 | 43 | $46.40 | Consumer Goods & Retail | 40% |
| JD | 59 | 66 | 52 | 44 | $44.52 | Consumer Goods & Retail | 75% |
| TikTok | 45 | $43.52 | Media & Entertainment | 158% | |||
| Deutsche Telekom | 25 | 25 | 32 | 46 | $43.10 | Telecom Providers | 16% |
| Tesla | 47 | $42.61 | Cars & Transportation | 275% | |||
| L'Oréal Paris | 44 | 43 | 44 | 48 | $38.31 | Consumer Goods & Retail | 30% |
| Ping An | 43 | 40 | 38 | 49 | $38.05 | Insurance | 13% |
| Brand | 2018년 | 2019년 | 2020년 | 2021년 | Brand Value |
Cartegory | Brand Value %Change 2021 VS. 2020 |
| Huawei | 48 | 47 | 50 | $38.02 | Technology | 29% | |
| ICBC | 22 | 29 | 31 | 51 | $37.77 | Financial Services | -1% |
| Zoom | 52 | $36.93 | Business Solutions & Tech Providers | ||||
| Intuit | 53 | $35.87 | Business Solutions & Tech Providers | ||||
| 83 | 58 | 54 | $35.52 | Media & Entertainment | 19% | ||
| Costco | 72 | 62 | 47 | 55 | $35.14 | Consumer Goods & Retail | 23% |
| Gucci | 54 | 53 | 49 | 56 | $33.84 | Consumer Goods & Retail | 24% |
| AMD | 57 | $32.92 | Business Solutions & Tech Providers | ||||
| Tata Consulting Services | 58 | $31.28 | Business Solutions & Tech Providers | ||||
| Xbox | 87 | 65 | 59 | $30.40 | Technology | 55% | |
| Vodafone | 37 | 49 | 55 | 60 | $29.74 | Telecom Providers | 29% |
| American Express | 35 | 33 | 46 | 61 | $28.58 | Financial Services | -3% |
| Wells Fargo | 18 | 23 | 42 | 62 | $28.00 | Financial Services | -8% |
| RBC | 52 | 57 | 60 | 63 | $27.61 | Financial Services | 33% |
| Toyota | 36 | 41 | 48 | 64 | $26.97 | Cars & Transportation | -5% |
| Haier | 89 | 65 | $26.42 | Technology | 41% | ||
| HDFC Bank | 60 | 60 | 59 | 66 | $26.37 | Financial Services | 27% |
| Mercedes-Benz | 46 | 54 | 67 | $25.84 | Cars & Transportation | 21% | |
| China Mobile | 21 | 27 | 68 | $25.82 | Telecom Providers | -25% | |
| Budweiser | 40 | 51 | 53 | 69 | $25.55 | Food & Beverages | 5% |
| Xiaomi | 74 | 81 | 70 | $24.89 | Technology | 50% | |
| BMW | 47 | 55 | 61 | 71 | $24.82 | Cars & Transportation | 21% |
| Dell Technologies | 81 | 71 | 72 | $24.78 | Business Solutions & Tech Providers | 36% | |
| LIC | 68 | 75 | 73 | $24.14 | Insurance | 38% | |
| J.P. Morgan | 73 | 73 | 74 | $24.11 | Financial Services | 37% |

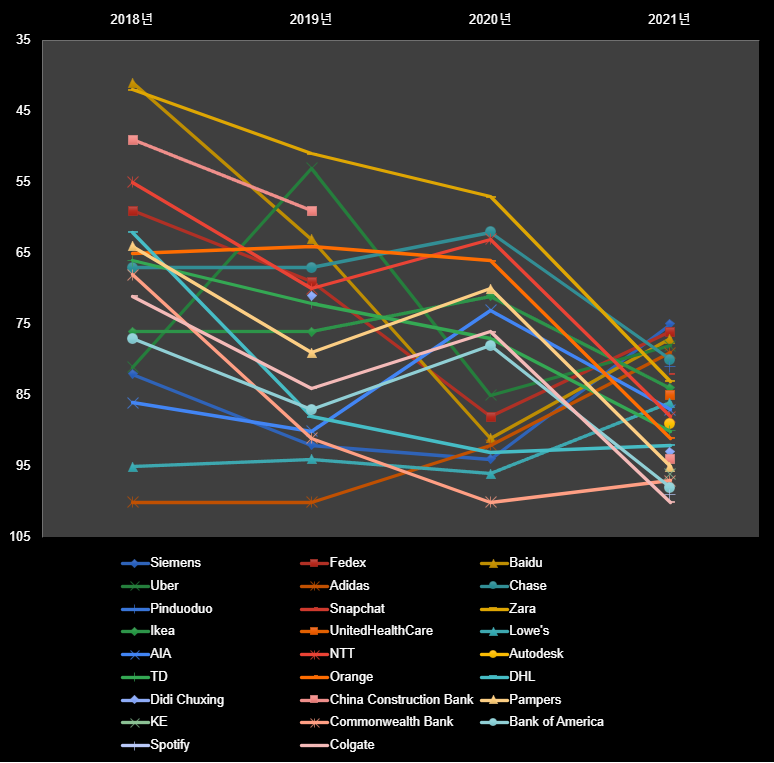
| Brand | 2018년 | 2019년 | 2020년 | 2021년 | Brand Value | Cartegory | Brand Value %Change 2021 VS. 2020 |
| Siemens | 82 | 92 | 94 | 75 | $23.64 | Conglomerate | 69% |
| Fedex | 59 | 69 | 88 | 76 | $23.59 | Logistics | 53% |
| Baidu | 41 | 63 | 91 | 77 | $23.36 | Media & Entertainment | 57% |
| Uber | 81 | 53 | 85 | 78 | $22.41 | Cars & Transportation | 41% |
| Adidas | 100 | 100 | 92 | 79 | $22.34 | Consumer Goods & Retail | 51% |
| Chase | 67 | 67 | 62 | 80 | $21.83 | Financial Services | 7% |
| Pinduoduo | 81 | $21.73 | Consumer Goods & Retail | 131% | |||
| Snapchat | 82 | $21.61 | Media & Entertainment | ||||
| Zara | 42 | 51 | 57 | 83 | $21.38 | Consumer Goods & Retail | 0% |
| Ikea | 76 | 76 | 71 | 84 | $21.02 | Consumer Goods & Retail | 17% |
| UnitedHealthCare | 85 | $20.87 | Insurance | 32% | |||
| Lowe's | 95 | 94 | 96 | 86 | $20.67 | Consumer Goods & Retail | 51% |
| AIA | 86 | 90 | 73 | 87 | $20.60 | Insurance | 16% |
| NTT | 55 | 70 | 63 | 88 | $20.48 | Telecom Providers | 1% |
| Autodesk | 89 | $20.45 | Business Solutions & Tech Providers | ||||
| TD | 66 | 72 | 77 | 90 | $20.21 | Financial Services | 17% |
| Orange | 65 | 64 | 66 | 91 | $20.20 | Telecom Providers | 4% |
| DHL | 62 | 88 | 93 | 92 | $20.14 | Logistics | 39% |
| Didi Chuxing | 71 | 93 | $20.04 | Cars & Transportation | 0% | ||
| China Construction Bank | 49 | 59 | 94 | $19.78 | Financial Services | -6% | |
| Pampers | 64 | 79 | 70 | 95 | $19.62 | Consumer Goods & Retail | 6% |
| KE | 96 | $19.50 | Consumer Goods & Retail | ||||
| Commonwealth Bank | 68 | 91 | 100 | 97 | $19.47 | Financial Services | 48% |
| Bank of America | 77 | 87 | 78 | 98 | $19.32 | Financial Services | 14% |
| Spotify | 99 | $19.28 | Media & Entertainment | ||||
| Colgate | 71 | 84 | 76 | 100 | $18.89 | Consumer Goods & Retail | 8% |
반응형
'경제' 카테고리의 다른 글
| 원유 Oil - 현대사회의 주축이 되는 원자재 (0) | 2022.10.11 |
|---|---|
| 시장에서 정해지는 주가는 합리적인가? 충동적인가? (0) | 2022.10.11 |
| 프랜시스 골턴의 소 몸무게 맞히기 - 집단지성 (1) | 2022.10.10 |
| 케인즈의 미인대회게임 - 좋은 주식? 좋다고 생각 되는 주식? (0) | 2022.10.07 |
| 장단기 금리가 역전되면 불황이 온다. (0) | 2022.09.27 |